Understanding stock charts is key for smart investors. These charts show a company’s financial health. They help spot trends and opportunities. Learning to read them can lead to better investment choices1.
Google makes it easy to see basic stock charts by searching for a company’s ticker. These charts show closing prices, after-hours changes, and historical data. This info helps you understand a company’s financial state and growth potential1.
Stock charts are more than just tools; they show the market’s heartbeat. By learning to read them, you can make smarter investment choices. This skill is also useful for evaluating job offers, analysing trends, and pitching clients. It’s a powerful tool for long-term success in investing.
Understanding Basic Stock Chart Components
To understand stock market trends, knowing the parts of a stock chart is key. There are three main types: line, bar, and candlestick. Each type offers different views of a stock’s performance2. Bar charts show the price range of each period. Volume and moving averages are also important for technical traders2.
Stock charts include opening, high, low, and previous close prices. These show the stock’s price range during trading hours. Market capitalisation shows a company’s size based on its share price and outstanding shares3. Volume indicators show how much trading activity there is.
Price-to-Earnings Ratio and Dividend Yields
Investors watch the price-to-earnings (P/E) ratio and dividend yield closely. The P/E ratio compares the share price to earnings per share3. The dividend yield shows the potential income from owning the stock, as a percentage of the share price3.
Other key parts of a stock chart include the 52-week high and low prices. These show the stock’s range over the past year. The bid and ask prices, beta, and moving averages are also important3. Knowing these helps with stock chart analysis and making informed investment choices.
“Traders look for confirmation in chart patterns to identify trends (at least one higher high and one higher low)2.”
Breakout patterns like triangles and flags are used for buy and sell signals2. But, price patterns can sometimes be wrong. So, traders use several indicators together to avoid mistakes2.
Support and resistance levels are also key in stock chart analysis. They act as a floor and ceiling for stock prices. These levels are important in trading plans. Long-term investors look at daily charts, while active traders prefer more detailed ones2.
By understanding stock chart components, investors can get valuable insights. This helps them make better investment decisions23.
Essential Stock Market Trends Graph Patterns
Learning to read stock market trends graphs is key for smart investing. Continuation patterns show a short pause in trends, while reversal patterns signal a trend change. These insights help predict market moves4.
Patterns like pennants and flags hint at a trend pause before it continues. The ascending triangle is bullish, while the descending triangle is bearish4. Symmetrical triangles can go either way, offering trading chances4.
Reversal patterns, like head and shoulders, signal trend shifts. The head and shoulders pattern warns of a bearish shift4. Double bottoms and cup and handle patterns suggest a bullish trend4.
| Chart Pattern | Trend Indication |
|---|---|
| Ascending Triangle | Bullish Continuation |
| Descending Triangle | Bearish Continuation |
| Symmetrical Triangle | Breakout Can Happen in Either Direction |
| Head and Shoulders | Bearish Reversal |
| Double Bottom | Bullish Reversal |
| Cup and Handle | Bullish Continuation |
Spotting these patterns helps traders find the best times to buy or sell4. Tools like triangles and wedges help spot trade chances5. Our scanner gathers data from over 120 products, saving time5.

Knowing these patterns gives investors an edge in the markets. Learn the basics of stock investing to improve your strategies45.
Different Types of Stock Chart Visualisations
Investors looking to make smart choices in the stock market have many chart types to choose from. Each type offers unique insights into price movements and trends6. From simple line charts to complex candlestick patterns, these tools are key for price visualisation and technical analysis.
Line Charts for Basic Trend Analysis
Line charts are essential for tracking stock prices over time7. They show the closing prices of a stock, helping investors spot trends and value changes. These charts are great for showing how different things relate to each other, like project timelines or population growth7.
Bar Charts and Their Components
Bar charts are excellent for comparing values in different categories7. They help display data distribution across categories clearly. With good labelling and colour use, bar charts are perfect for ranking and showing important data points7.
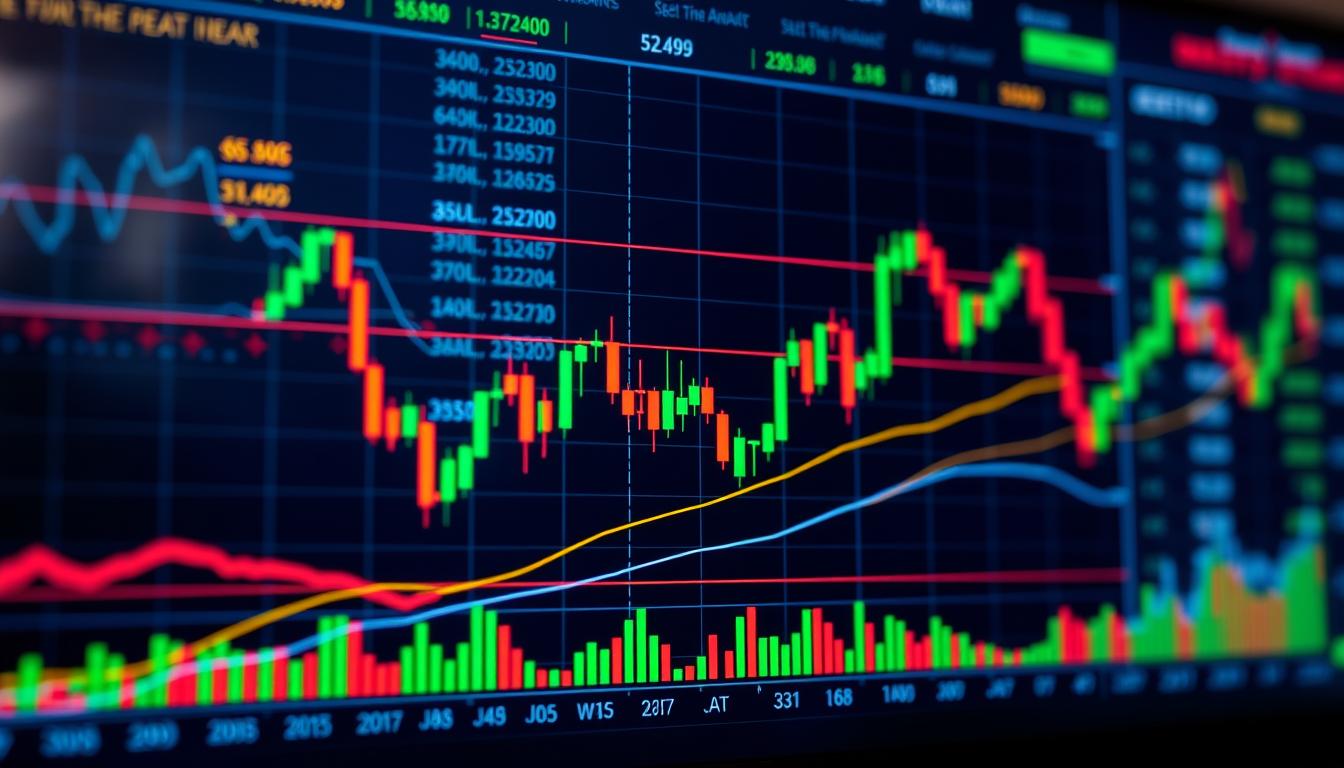
Candlestick Charts and Pattern Recognition
Candlestick charts give a detailed look at price action, showing the difference between opening and closing prices6. They help analysts spot bullish or bearish trends and patterns, like reversals or continuations. Used with other technical analysis tools, candlestick charts offer a deep understanding of market trends and opportunities6.
Each chart type has its own benefits and can be used together for a full view of the stock market. Investors who learn to use these chart types well can have an edge in the financial markets.
Advanced Technical Analysis Indicators
Technical analysis is a powerful tool for spotting and using market trends. Experienced traders use advanced technical indicators to check market signals and find profitable trades8. These tools include on-balance volume (OBV) to see buying and selling pressure8, the accumulation/distribution (A/D) line for money flow8, and the average directional index (ADX) for trend strength8.
The aroon oscillator watches new highs and lows to see if a security is in a trend8. Moving average convergence divergence (MACD) and relative strength index (RSI) help find trend direction and momentum8. The stochastic oscillator spots overbought or oversold conditions8. By mixing these indicators, traders can build a strong system for market navigation8.
Support and resistance levels are key in technical analysis, showing where prices might change9. Breakout patterns like triangles and flags give clear signals for entering and leaving trades9. A mix of technical indicators and pattern recognition is vital for smart trading decisions9.
| Technical Indicator | Description |
|---|---|
| On-Balance Volume (OBV) | Measures positive and negative flow of volume, reflecting buying and selling pressure. |
| Accumulation/Distribution (A/D) Line | Assesses money flow in and out of a security based on the relationship between the close and trading range. |
| Average Directional Index (ADX) | Indicates trend strength, with values above 40 signalling strong directional trends. |
| Aroon Oscillator | Monitors new highs and lows to determine if a security is in a trend. |
| Moving Average Convergence Divergence (MACD) | Helps traders identify trend direction and momentum, with crossings and crossovers providing signals. |
| Relative Strength Index (RSI) | Gauges momentum and trend strength, also identifying overbought and oversold conditions. |
| Stochastic Oscillator | Measures current price relative to the price range over periods, indicating potential overbought or oversold conditions. |
By using technical indicators and chart patterns, traders can understand market trends and momentum9.
“The key to successful trading is to have a well-defined trading system that incorporates both technical and fundamental analysis.” – John Murphy, author of “Technical Analysis of the Financial Markets”.
Conclusion
Learning to read stock market trends is key for smart investors. It helps them make better choices and improve their investment plans. By understanding stock charts, spotting patterns, and using different ways to see data, investors can uncover important market trends and chances.
Trend analysis looks at short, medium, and long-term trends. It helps spot when markets are going up, down, or staying the same10.
Trend analysis has its benefits. It can help find good times to buy or sell, reduce risks, and make better choices10. But, it also has its downsides. It relies on past data, might not always be right, and markets can be unpredictable10.
Despite these challenges, learning various technical analysis skills is vital. This includes using moving averages, momentum indicators, and trendlines & chart patterns10. It helps investors fully understand market trends and improve their investment results.
The UK stock market has shown strong resilience. The GB100 index hit a record high of 8478.70 in May 2024. It’s expected to be around 8297.19 by the end of the quarter11. Investors need to keep up with the latest news and trends.
By watching how top UK companies like AstraZeneca, HSBC Holdings, and others perform11, investors can make smart choices. This helps them take advantage of market chances and build a winning investment strategy.
FAQ
What are the essential components of a stock chart?
Stock charts show important details like opening, high, low, and previous close prices. They also include market capitalisation, volume indicators, and ratios like PE and dividend yield. These help investors understand a company’s performance and make smart choices.
What are the common stock chart patterns, and how can they be used for investment decisions?
Chart patterns help spot trend changes and trading chances. Continuation patterns like pennants and flags show ongoing trends. Reversal patterns, like head and shoulders, signal changes. Knowing these patterns helps traders know when to buy or sell.
What are the different types of stock charts, and how do they differ in their visualization of price data?
There are line, bar, and candlestick charts. Line charts show closing prices. Bar charts display price range and closing prices. Candlestick charts give a detailed view of price action. Each has its own use and can be used together with other tools.
What are some common technical analysis indicators, and how can they be used to confirm trends and generate trading signals?
Technical analysis uses indicators like moving averages and volume analysis. These help confirm trends and give trading signals. Using several indicators together helps avoid false signals. Support and resistance levels, and breakout patterns, also guide entry and exit points.
How can mastering stock chart reading improve investment decisions?
Understanding stock charts is key to smart investing. Knowing chart basics, patterns, and using different charts and indicators gives insights into market trends. Creating a personal system of indicators and patterns is vital for successful trading.


 By
By


 By
By